Register now, make more friends, enjoy more functions, and let you play in the community easily.
You need Sign in Can be downloaded or viewed without an account?Register Now 
x
Preface: Unplanned investment is called a puzzle, planned investment is called a blueprint, aimless trading is called wandering, and purposeful trading is navigation!Bees are busy all day, and everyone loves them. Mosquitoes run around all day, and everyone shouts and beats them!So in the market, whether you are busy or not is important, and what you are busy with is important!Tourism requires a tour guide!Investment definitely requires a mentor!
goldAnalysis of Operational Suggestions:
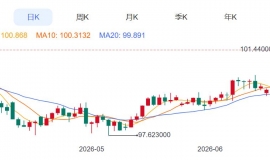
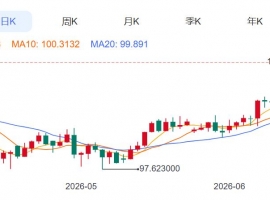
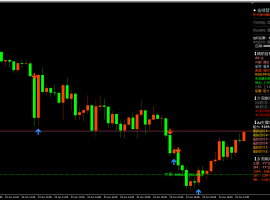
Gold from4From the hourly chart, it can be seen that gold is moving downwards at a high point and hitting a new low as a bearish trend in the inter community trend, while the overall trend is moving upwards at a low point and hitting a new high as a bullish trend. Currently, the small trend and the overall trend are opposite, so we need to be careful. The small trend can affect the overall trend, and the overall trend determines the small trend. In the short term, gold is caught in a long short game. Pay attention to the previous band below in the short term1343and1324of61.8%Position line suppression, that is1336One line suppression, pay attention to the frequency band below1343reach1324of38.2%Position line support, that is1332One line support, this position is also the consolidation band position of yesterday. Short term will play a watershed role between long and short, and breaking the level will accelerate the downward trend of gold, hitting the previous low point1324Frontline position, gold will strengthen without breaking, pay attention above1336One line suppression, this position is in the frequency band1343reach1324of61.8At this position, if it breaks, the bearish trend of the gold mini trend will end, and the overall trend will strengthen synchronously with the mini trend. From the perspective of indicators,RSIHigh position turning head downwards,StochThe indicator runs at a high level, and there is a high probability of the indicator being biased towards adjustment. It is recommended to pay attention to it from above1336and1340and1345First line pressure level, follow below1330and1326and1322First line support position.
crude oilAnalysis of Operational Suggestions:
Crude oil trend analysis: Thursday's high volatility fell back, Asian market first explored64.30Under pressure in one area, after two consecutive highs, it fell around the Asian high point and eventually closed at63.50At a low level, it opened weakly today and broke through the low. The daily chart closed with a small shadow and fell behind10Daily chart, continue to adjust today. From a technical perspective, based on the daily chart, oil prices continue to be under pressure5Daily moving average,KDJandRSIThe dead fork runs well,MACDThere are signs of a dead cross in the green flip, and the bearish signal has strengthened. In the short term, it has even fallen below10Daily moving average, if it cannot quickly recover to10Daily moving average63.64Above, oil prices may accelerate their decline, while the Bollinger Bands continue to open upwards, testing20The daily moving average is supported by61.91Near support, the short-term trend of the daily chart is bearish, and the medium-term risk is upward;4On the hourly line, yesterday exceeded four hours25MALater on, it did not stabilize and fell below the four hour Bollinger Bands median in the short term, while the daily chart showedStochHigh position dead cross, adjustment is not over yet,MACDDead fork operation,KDJRe form a dead cross and run, the Bollinger Bands show signs of opening. If they cannot recover63.47Near resistance, oil prices may move downwards on the Yanbulin offline track,4The hourly cycle trend is bearish. Overall, ThursdayEIAThe data is positive, but it has not been able to reverse the downward trend, and crude oil has not stabilized64Frontline and daily levels are facing adjustments, and short-term operations are mainly focused on hitting high levels, with attention paid to resistance above64-63.8frontline.
The market is like the ocean, and we appear so small in the market. However, the appearance of analysts is like a lighthouse, guiding direction, but we do not know whether it is heaven or hell. Many friends in the market have encountered situations where they encounter inappropriate people, not knowing if they have encountered demons with angel wings that have tricked them into hell. Only then do you realize that they cannot come up with a solution. Angels have all given one sentence: Don't let your eyes deceive you, don't let anger confuse you, calm down, and remember what tools you have that can help you survive.
Teacher Mengxian (official WeChat:mengxian909 QQ:982200437)Proficient in applying wave theoryKBands, Bollinger BandsMACDAnalyzing and predicting market trends. Proficient in using various technical indicators, thus forming a unique risk control system and trading system. If you need psychological guidance, investment plans, are interested in investing in precious metals such as crude oil and gold but have no idea where to start, or have friends who are already in contact but not ideal, and want to keep up with the stable market layout, please follow "Dream Immortal Teacher". |
"Small gifts, come to Huiyi to support me"
No one has offered a reward yet. Give me some support
|

 ZFX山海证券:金价退守4100USD barrier
全球黄金市场正在经历一场剧烈的调整。周二(6month22日)现货黄金价格大幅下跌1.9%,触
ZFX山海证券:金价退守4100USD barrier
全球黄金市场正在经历一场剧烈的调整。周二(6month22日)现货黄金价格大幅下跌1.9%,触
 Aurra Markets:标普 500 技术性破位
为何标普 500 和纳斯达克指数同步抛售?一轮显著的隔夜跳空下跌,使标普 500 指数与
Aurra Markets:标普 500 技术性破位
为何标普 500 和纳斯达克指数同步抛售?一轮显著的隔夜跳空下跌,使标普 500 指数与
 Aurra Markets:韩国 KOSPI Index plummeting
韩国股市为何遭遇最糟糕交易日之一? 韩国股市近期出现剧烈震荡,股价大幅下跌,引
Aurra Markets:韩国 KOSPI Index plummeting
韩国股市为何遭遇最糟糕交易日之一? 韩国股市近期出现剧烈震荡,股价大幅下跌,引
 原油期货是什么?一篇搞懂WTI、布兰
近年来国际油价如同云霄飞车,剧烈的波动不仅影响着你我的荷包,更吸引了全球投资者的目
原油期货是什么?一篇搞懂WTI、布兰
近年来国际油价如同云霄飞车,剧烈的波动不仅影响着你我的荷包,更吸引了全球投资者的目
 2026year6month23day Evening17:12 金价跌破41
今天这行情真是够刺激的。早上开盘金价还在4190附近晃悠,结果亚盘直接跳水,一
2026year6month23day Evening17:12 金价跌破41
今天这行情真是够刺激的。早上开盘金价还在4190附近晃悠,结果亚盘直接跳水,一


 Riser card
 Top card
 Silence card
 Color changing card
 lifting jack