"Small gifts, come to Huiyi to support me"
No one has offered a reward yet. Give me some support
| |
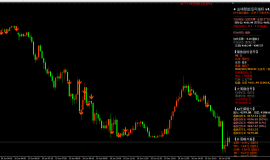
 2026year6month10day afternoon | Gold price4170wait forC
下午好,盘面这会儿交投清淡,金价卡在4170dollar/盎司横着走,上下不到5美金的波动
2026year6month10day afternoon | Gold price4170wait forC
下午好,盘面这会儿交投清淡,金价卡在4170dollar/盎司横着走,上下不到5美金的波动
 ZFX山海证券端午礼献:礼承山海,味
端午从来不止是粽叶飘香的时令节点,更是一场关于安康祈愿、自然敬畏与文化传承的东方
ZFX山海证券端午礼献:礼承山海,味
端午从来不止是粽叶飘香的时令节点,更是一场关于安康祈愿、自然敬畏与文化传承的东方
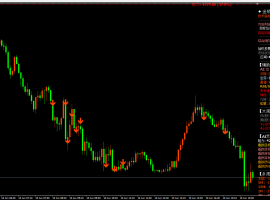
 Aurra Markets:【原油走势分析】WTI
中东局势紧张,WTI原油为何不涨反跌? WTI 原油期货经历剧烈震荡,盘中交易区间一度
Aurra Markets:【原油走势分析】WTI
中东局势紧张,WTI原油为何不涨反跌? WTI 原油期货经历剧烈震荡,盘中交易区间一度
 教你寻找可靠的线上实物黄金平台
在通胀避险、资产保值的需求驱动下,实物黄金成为大众稳健投资的核心品种,那么足不出
教你寻找可靠的线上实物黄金平台
在通胀避险、资产保值的需求驱动下,实物黄金成为大众稳健投资的核心品种,那么足不出
 Aurra Markets:美国空袭伊朗后,股
美国近期空袭伊朗如何影响中东局势与金融市场? 美国近期对伊朗目标发动军事空袭,
Aurra Markets:美国空袭伊朗后,股
美国近期空袭伊朗如何影响中东局势与金融市场? 美国近期对伊朗目标发动军事空袭,
MIP|Mobile version|A small dark room| |Site Map |customer serviceQQ:2381682638
Copyright © 2006-2024 Huiyi Interaction https://www.forexbbs.net copyright All Rights Reserved.


 Riser card
 Top card
 Silence card
 Color changing card
 lifting jack