Register now, make more friends, enjoy more functions, and let you play in the community easily.
You need Sign in Can be downloaded or viewed without an account?Register Now 
x
If you can't hold onto the sand, simply raise it. What you can see but can't hold onto is not an opportunity, so since you can't hold onto it, it's better to let go calmly. Everyone has different views on the market, which is normal. There is no need to envy others for their profits, because when they are losing money, you cannot see it. Most people only see the bright side of successful people, but never expect that a successful person must first experience setbacks and failures. Instead of admiring fish in the distance, it's better to retreat and form a net. You don't have to envy others' profits, just plan your own transactions. People who can't hold a grain of sand in their eyes, those who are difficult to see further, can only come from behind and attract enemies deeply to gather and annihilate them. A strategic successful layout is better than countless local victories, and you don't need to worry about the gains and losses of a city or a place. Instead, you need to focus on the long term to make a difference in the leisurely and chaotic market. 
goldTrend analysis: From the daily chart, gold closed with a large negative line yesterday, breaking through structural levels strongly1270Frontline, but also1260reach1263reach1265The upward trend line, whileKThe physical part of the consolidation band in the early stage is broken by the physical part of the line, and the gold daily line is running empty. The daily line will run at the daily level5Wave down trend, currently gold is operating in a downward trend3Wavelike5The downward trend of waves, with a focus on today1270The pressure at the first line position is1260reach1263reach1265The counter pressure level of the upward trend line is also the bottom of the previous consolidation band. This time, there will be strong pressure. If gold does not break this position, it will enter a bearish trend of top to bottom conversion. From the indicators, the Bollinger Belt will open downwards, while the middle track of the Bollinger Belt will turn downwards,StochLow level passivation of indicators,RSILow level leveling,MACDIndicator negative column release, indicator biased towards empty operation; from4Looking at the hourly chart, yesterday's strong downward trend of gold broke through the band1263reach1299of76.4%Location, i.e1271On the first line, the bearish trend of gold has been formed, and the consolidation band has also been broken. Gold will continue its bearish trend and continue to decline. In terms of operation, the main idea of short selling on high remains unchanged. From the perspective of indicators,RSILower the turning head downwards,StochThe low gold cross of the indicator is currently running at a medium high level, while the European market is testing back1270The pressure level remains low, and the top constitutes a bearish engulfmentKIn line form, gold has emerged from a bearish trend of top to bottom conversion, whileMacdThe Yin column of the market continues to amplify, and the strength of the bears continues to strengthen. In terms of operation, maintain high altitude and pay attention to the above during the day1270and1276First line pressure level, follow below1260and1255and1250First line support position. For more timely operational strategies, please follow Gong Chonghao's "Dingyuan Jufu" friend who has a set of orders. You can consult me. As I, Dingyuan Jufu, do not know the location and detailed information of your set of orders, it is not easy to provide corresponding unwinding strategies. If you need to unwind, please contact me on a single linev:YJYS95 
crude oilTrend analysis: The overall bullish and bearish trend of crude oil has not yet fully emerged, and from today's daily chart, it is mainly a bearish trend. At present, the daily line is gradually closing in, the third line of the Bollinger Belt is leveling out, and the oil price is running above the middle rail of the Bollinger Belt, which is affected by the middle rail of the Bollinger Belt56.8The US dollar is supported on the first line, and there are signs of further pullback in oil prices.4The overall trend of the hour tends to be bullish, with short-term demand for a pullback. Crude oil has been continuously hitting new highs for nearly two years59After the first line, the bulls are weak, and oil prices have been retreating recently. Whether this retreat is an adjustment or a pullback remains to be confirmed. At present, there is still a wave of rebound in crude oil57.5Around the US dollar. So the operational approach is to first empty and then many. Focus on the support below56Dollar line, looking up57A line of resistance. Fundamentals focus onEIAdata 
Friends who are interested in investing in precious metals such as crude oil, gold, and silver but are unable to start or are already in contact but not ideal are welcome to follow 'Dingyuan Jufu' (Wei-newyjys95)Official account obtains daily market trend analysis and trading strategy guidance. |
"Small gifts, come to Huiyi to support me"
No one has offered a reward yet. Give me some support
|

 Aurra Markets:道指与纳指分化,CPI
为何道指上涨而纳斯达克指数下跌?美股市场在本交易日呈现明显分化走势:以工业板块
Aurra Markets:道指与纳指分化,CPI
为何道指上涨而纳斯达克指数下跌?美股市场在本交易日呈现明显分化走势:以工业板块
 Aurra Markets:苹果股价下跌 6.2%:
苹果能否挺过 Mac and iPad 涨价的冲击?苹果近期上调 Mac And iPad 产品价格的决定,
Aurra Markets:苹果股价下跌 6.2%:
苹果能否挺过 Mac and iPad 涨价的冲击?苹果近期上调 Mac And iPad 产品价格的决定,
 ZFX山海证券:金价重返4000USD!
Spot Gold Thursday(6month25日)震荡反弹反转,收复4000美元重要心理关口。这一反弹并非偶然
ZFX山海证券:金价重返4000USD!
Spot Gold Thursday(6month25日)震荡反弹反转,收复4000美元重要心理关口。这一反弹并非偶然
 ZFX山海证券:金价创七个月新低!
Wednesday(6month24日),现货黄金价格大幅下挫2.7%,最终报收于每盎司3998.95美元,不仅跌破
ZFX山海证券:金价创七个月新低!
Wednesday(6month24日),现货黄金价格大幅下挫2.7%,最终报收于每盎司3998.95美元,不仅跌破
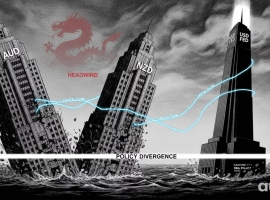 Aurra Markets:澳元兑美元走势分析
澳元与纽元为何持续走弱? 随着美元走强主导外汇市场,澳元和纽元正承受显著压力。这
Aurra Markets:澳元兑美元走势分析
澳元与纽元为何持续走弱? 随着美元走强主导外汇市场,澳元和纽元正承受显著压力。这


 Riser card
 Top card
 Silence card
 Color changing card
 lifting jack