"Small gifts, come to Huiyi to support me"
No one has offered a reward yet. Give me some support
| |||
| |
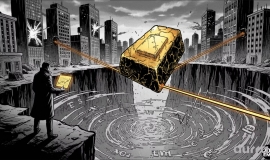
 Aurra Markets观察:退潮之后,是谁
今年一季度,全球黄金市场曾出现过一波明显的“拥挤交易”。黄金 ETF 交易量激增,
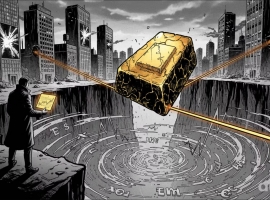
Aurra Markets观察:退潮之后,是谁
今年一季度,全球黄金市场曾出现过一波明显的“拥挤交易”。黄金 ETF 交易量激增,
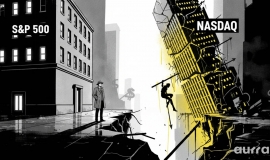
 Aurra Markets:标普 500 指数走势展
S&P 500 指数稳中有进,纳斯达克指数为何承压难行? 美国主要股指正呈现出显著的分
Aurra Markets:标普 500 指数走势展
S&P 500 指数稳中有进,纳斯达克指数为何承压难行? 美国主要股指正呈现出显著的分
 Aurra Markets:OpenAI 秘密递交华尔
OpenAISubmit IPO 申请对人工智能的未来意味着什么? OpenAI 近日启动首次公开募股(I
Aurra Markets:OpenAI 秘密递交华尔
OpenAISubmit IPO 申请对人工智能的未来意味着什么? OpenAI 近日启动首次公开募股(I
 ZFX山海证券:金价探底回升!
Monday(6month8日)金价一度跌至近两个半月以来的最低点4268美元附近,但随后又神奇地收复
ZFX山海证券:金价探底回升!
Monday(6month8日)金价一度跌至近两个半月以来的最低点4268美元附近,但随后又神奇地收复
 香港黄金交易所金条金币介绍
Hong Kong Gold and Silver Trading Centre&香港黄金交易所:股市有证券交易所,黄金也有交易所,香港黄金交易
香港黄金交易所金条金币介绍
Hong Kong Gold and Silver Trading Centre&香港黄金交易所:股市有证券交易所,黄金也有交易所,香港黄金交易
MIP|Mobile version|A small dark room| |Site Map |customer serviceQQ:2381682638
Copyright © 2006-2024 Huiyi Interaction https://www.forexbbs.net copyright All Rights Reserved.


 Riser card
 Top card
 Silence card
 Color changing card
 lifting jack