"Small gifts, come to Huiyi to support me"
No one has offered a reward yet. Give me some support
| |
 黄金市场惊魂震荡:万洲金业双向交易
近期,黄金市场犹如坐上了疯狂的过山车,上演了一幕惊心动魄的行情。现货黄金在触及55
黄金市场惊魂震荡:万洲金业双向交易
近期,黄金市场犹如坐上了疯狂的过山车,上演了一幕惊心动魄的行情。现货黄金在触及55
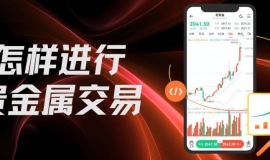
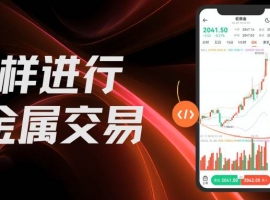 怎样进行贵金属交易?2026十大贵金属
在全球经济波动加剧的背景下,贵金属投资凭借其避险属性与增值潜力,持续成为投资者资
怎样进行贵金属交易?2026十大贵金属
在全球经济波动加剧的背景下,贵金属投资凭借其避险属性与增值潜力,持续成为投资者资
 如何炒黄金外汇赚钱?分享十大炒黄金
在金融投资领域,外汇黄金交易凭借避险属性与流动性优势备受青睐。然而,全球超3000home
如何炒黄金外汇赚钱?分享十大炒黄金
在金融投资领域,外汇黄金交易凭借避险属性与流动性优势备受青睐。然而,全球超3000home
 ZFX山海证券:金价暴跌!重回5000beautiful
黄金上周五大幅下挫,金价创下自1983年以来最大单日跌幅,此前,特朗普宣布提名前美联
ZFX山海证券:金价暴跌!重回5000beautiful
黄金上周五大幅下挫,金价创下自1983年以来最大单日跌幅,此前,特朗普宣布提名前美联
 What are the investment channels for domestic spot gold?2026just
stay2026In the year, spot gold investment relies on its24The advantages of hourly trading, two-way operation, and leverage mechanism have become high-risk preferences
What are the investment channels for domestic spot gold?2026just
stay2026In the year, spot gold investment relies on its24The advantages of hourly trading, two-way operation, and leverage mechanism have become high-risk preferences
MIP|Mobile version|A small dark room| |Site Map |customer serviceQQ:2381682638
Copyright © 2006-2024 Huiyi Interaction https://www.forexbbs.net copyright All Rights Reserved.


 Riser card
 Top card
 Silence card
 Color changing card
 lifting jack