Register now, make more friends, enjoy more functions, and let you play in the community easily.
You need Sign in Can be downloaded or viewed without an account?Register Now 
x
一、基本面解析:
EveningEIAAn increase in natural gas inventories, predicted value250/Billion cubic feet, actual value290/亿立方英尺,数据一公布,天然气价格跳跌,然后暴涨之后走低。天然气过山车式的行情让很多分析师、投资者摸不着头脑。
FirstlyEIAThe increase in natural gas inventories and bearish data caused a jump in prices, but was affected bycrude oilDriven by the skyrocketing market, natural gas experienced a surge followed by a subsequent decline. In the unusually hot weather of the United States, coupled with low natural gas prices, power plants in the country used record sized natural gas to generate electricity last month to meet the skyrocketing demand for air conditioning.
According toEIAThe data shows that the cabbage like trend in natural gas prices has also driven natural gas production to improve2014-2015After a significant annual growth, it stagnated, and the record breaking consumption helped to consume again2015The huge inventory formed from the year to the first few months of this year. As a result, although natural gas inventories remain at a high level during the same period, the pace of growth has slowed down.
从上面的数据中笔者分析出,由于数据利空,导致开始暴跌,然后因为上面数据的影响,来了一拨暴涨,不过由于数据是利空,天然气最终还是跌下去了。接下来我们从技术面上来分析今天各大品种的走势情况。更多行情分析及市场走势可加苏倩芩指导薇信xly645Learn more.
二、技术面分析:
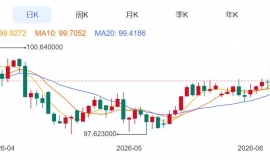
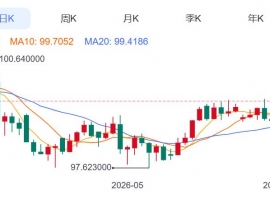
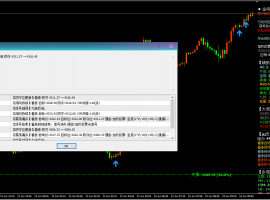
Low opening of natural gas today19From a daily perspective,KAfter breaking through the Bollinger medium track, the line runs downwards all the way,5The daily moving average has a downward crossing10Daily moving average,MACDThe dead cross has formed, and the green bar energy is starting to increase,KDJThe indicator's dead cross diverges downwards.
From the four hour chart, it can be seen that the Bollinger Belt continues to move downwards,KThe line runs between the lower and middle rails,5Daily moving average and10The daily moving averages are all moving downwards,MACDThe indicators are about to bond, and the green energy column is shortening,KDJIndicatorJStarting from the hour chart, the Bollinger Bands are closing,KThe line runs between the upper and middle rails,MACDThe indicator continues to move upwards, with the red energy column increasing in volume. In the evening, the author suggests short selling during high periods.
三、苏倩芩晚间天然气具体操作策略:
1.Above natural gas prices3720Short on the front line, stop loss30Point, look at the target3660;
2.Below natural gas3600Long on the front line, stop loss30Point, look at the target3700。
操作建议无法揭示交易中的所有风险和市场情形,故仅供参考,不作为操作依据,若想知即时操作建议精准点位分析及策略,投资者可咨询笔者苏倩芩指导薇信xly645Real time guidance. |
"Small gifts, come to Huiyi to support me"
No one has offered a reward yet. Give me some support
|

 ZFX山海证券:金价上涨近100USD!
Monday(6month15日)亚市早盘,现货黄金高开高走,一度上涨2.18%to4308.91dollar/盎司,为近
ZFX山海证券:金价上涨近100USD!
Monday(6month15日)亚市早盘,现货黄金高开高走,一度上涨2.18%to4308.91dollar/盎司,为近
 Aurra Markets:WTI 原油暴跌,美伊
WTI原油因美伊协议预期大幅下挫 受美伊可能达成协议的地缘政治消息推动,西德克萨
Aurra Markets:WTI 原油暴跌,美伊
WTI原油因美伊协议预期大幅下挫 受美伊可能达成协议的地缘政治消息推动,西德克萨
 Aurra Markets:美伊战争结束,油价
美国和伊朗是如何达成和平协议结束战火? 美国与伊朗已达成和平协议,以终止双方持
Aurra Markets:美伊战争结束,油价
美国和伊朗是如何达成和平协议结束战火? 美国与伊朗已达成和平协议,以终止双方持
 2026year6month15day | 上午10spot21branch | beautiful
兄弟们都盯着盘面了吧,今天这行情真是开眼了。早上起来一看,金价直接高开将近70
2026year6month15day | 上午10spot21branch | beautiful
兄弟们都盯着盘面了吧,今天这行情真是开眼了。早上起来一看,金价直接高开将近70
 腾龙娱乐线上app怎么下载
(腾龙娱乐注册开户域名 ( tl12886.com ) 以上域名不会的加QQ 2573575965
腾龙娱乐线上app怎么下载
(腾龙娱乐注册开户域名 ( tl12886.com ) 以上域名不会的加QQ 2573575965


 Riser card
 Top card
 Silence card
 Color changing card
 lifting jack