Register now, make more friends, enjoy more functions, and let you play in the community easily.
You need Sign in Can be downloaded or viewed without an account?Register Now 
x
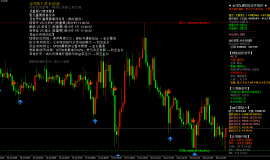
goldTrend analysis:
Yesterday was affected byCPIThe impact of bullishness has led to a significant increase in gold prices, reaching2048After the first line, suppress the downward trend, and at one point during the session2022On the first line, after the daily chart was launched, the price was immediately backhanded and vacant2047The price also fell for a while, and the closing price was given by changing the line at 10 o'clock in the late trading day40The bearish mentality continues below, and from the current trading situation, the daily chart is closing with a cross star. Objectively speaking, it cannot be said which side is strong in the long and short. The power is still balanced, but the price is currently running close to the upper limit. Today is Thursday again, and personal expectations are still in a volatile market, with prices breaking through2053Previously, we cannot look too far, but we cannot look too short because from the chart, we have entered a new oscillation chart with the top2052-55, offline2012-2000This is a large framework, but it does not have much operational significance, but it is important to grasp a principle and approach2050I didn't suggest chasing more before, but instead, I'm breaking2060Don't blindly guess the top again in the future. The probability of breaking the intention to break the top is basically a high probability. Although I don't want to admit it, objectively speaking, it is a fact. Therefore, for the current market, it cannot be a dead long position or a dead short position. If the price rises, it will suppress the short position, and if the price falls, it will support the long position.
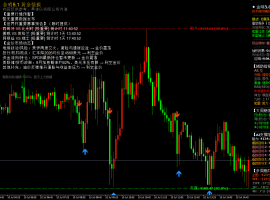
crude oilLatest market trend analysis:
Analysis of crude oil message surface:5month11At the beginning of the Asian market on Thursday, US crude oil was trading at72.83dollar/Near the barrel; Oil prices fell on Wednesday, ending three consecutive days of upward trend. Economic data was mixed and did not provide a clear interest rate path for the Federal Reserve. However, inflation data suggests that the Federal Reserve may continue to raise interest rates; The US crude oil inventory unexpectedly increased, and the US debt ceiling impasse triggered economic concerns, dragging down oil prices. US Energy Information Administration(EIA)On Wednesday, it was announced that due to the re release of national reserves and a decline in exports, US crude oil inventories unexpectedly increased last week, while the decline in gasoline inventories exceeded expectations due to a jump in demand. Analysts said: 'Oil prices are under pressure due to economic growth concerns related to the banking crisis and normal seasonal weakness caused by slower energy demand in spring. Oil buyers in Asia and Europe have had to pay high prices for lower quality and heavily polluting crude oil due to sanctions against Russia andOPEC+The reduction in production has reduced the supply of these grades of crude oil. On the whole, oil prices are affected by higher inflation data, and the unexpected increase of US crude oil inventory, and the US debt ceiling impasse has further triggered economic concerns, and the increase of oil prices may be limited; Key focus for the dayOPECMonthly report.
Technical analysis of crude oil: crude oil reached a high yesterday, fell back and leveled off, with a slight negative daily trendKThe physical size of the line is not large, and there is a slight lack of kinetic energy in some areas after the rebound of the continuous yang. Yesterday, it only reached a high point due to inertia and still fell and closed down, reaching its highest point73.80Back testing of the rear endplate to71.80.The walking method of sawing and washing dishes back and forth shows that the short-term single sided bull head lacks kinetic energy, and the walking method of sorting and accumulating momentum while stepping back.4After stabilizing at the mid track, the hourly chart rebounded and the upper track still fell under pressure. Currently, Bollinger Road is beginning to contract. The interval is slightly smaller, and with the addition of previous data from the bottom63.63Since the rebound, we have approached0.5And the golden point0.618Heavy resistance. During the first rebound, the short term will be accompanied by repeated detours to consolidate and accumulate momentum. At the same time, it is also a stage of choosing a new direction. Will it be a rebound that comes under pressure and leads back down, or will it be a strong rebound with a double bottom? Currently rebounding in the range83.50-63.60Choose between neutral values, and the short-term should be based on the intraday form, while the ultra short-term should respond. Overall, Guo Shengxin suggests that the short-term operation strategy for crude oil today should mainly focus on a pullback to lower levels, supplemented by a rebound to higher levels, with a focus on short-term operations above74.5-75.0Frontline resistance, short-term focus below71.7-71.2Frontline support.
This article is written by Guo ShengxinVX:gsx2567For reference only, I am reading online and analyzing in real-time every day. Due to network issues, the article can only provide you with temporary directions and ideas. As for the specific operations in the later stage, they will be provided in real-time in the group disk.
|
"Small gifts, come to Huiyi to support me"
No one has offered a reward yet. Give me some support
|

 7month10日午后黄金策略:金价回落至411
目前消息面对黄金还是偏压制。市场对美国利率继续维持高位、甚至进一步收紧的预期有
7month10日午后黄金策略:金价回落至411
目前消息面对黄金还是偏压制。市场对美国利率继续维持高位、甚至进一步收紧的预期有
 ZFX山海证券:金价惊险重返4100dollar
7month9日,国际黄金市场上演了一场惊心动魄的逆转大戏。在经历了连续三个交易日的下跌之
ZFX山海证券:金价惊险重返4100dollar
7month9日,国际黄金市场上演了一场惊心动魄的逆转大戏。在经历了连续三个交易日的下跌之
 ZFX山海证券:金价坚守4000Pass!
Wednesday(7month8日)现货黄金价格一度跌至4020美元附近,油价应声暴涨逾5%,刷新逾两周高点
ZFX山海证券:金价坚守4000Pass!
Wednesday(7month8日)现货黄金价格一度跌至4020美元附近,油价应声暴涨逾5%,刷新逾两周高点
 7month9日早上黄金策略:金价深V反弹后
昨晚黄金走了一波急跌,盘中一度逼近4020关口,随后展开深V反弹收复大部分跌幅,最
7month9日早上黄金策略:金价深V反弹后
昨晚黄金走了一波急跌,盘中一度逼近4020关口,随后展开深V反弹收复大部分跌幅,最
 ZFX山海证券:金价被油价大涨压制!
Tuesday(7month7日),油价大幅飙升,现货黄金当日下跌1.42%, receive reports per ounce4105美元,盘中一
ZFX山海证券:金价被油价大涨压制!
Tuesday(7month7日),油价大幅飙升,现货黄金当日下跌1.42%, receive reports per ounce4105美元,盘中一


 Riser card
 Top card
 Silence card
 Color changing card
 lifting jack