Register now, make more friends, enjoy more functions, and let you play in the community easily.
You need Sign in Can be downloaded or viewed without an account?Register Now 
x
Perhaps I don't have fancy language to persuade your heart; But I have real strength to satisfy your desires! Looking forward to all investors verifying their strength, Teacher Song Yiyang welcomes you and makes me a stepping stone on your path to success.
【4.17goldMessage Analysis
Last Friday(4month14day)The gold market ended this week with another significant fluctuation. Rising on Thursday13After reaching a high of six months, gold prices took back all their weekly gains and fell on the same day40USD. In late US trading, spot gold closed higher2003.79element/Ounces, down36.24USD or1.78%The highest daily hit2047.43dollar/Ounces, lowest touch2003.79dollar/ounce. With gold facing technical selling pressure, it took back most of its weekly gains. However, before the weekend, many analysts said that a healthy correction in the market was long overdue, which could lead to a sustainable long-term rise in gold prices to historic highs. Some analysts say that:Gold has recently seen a strong uptrend, but the momentum seems to have slowed slightly and there seems to be a technical pullback. With many bullish news that has driven this month long uptrend starting to fade, it is not surprising that gold will face some selling pressure on Friday.
【4.17Analysis of Gold Market Trend
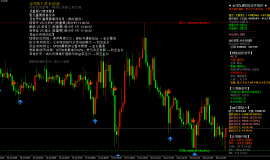
In terms of gold, the market opened low at the beginning of the week last week1989.7After the position of the market, the market will first fall and give a weekly low point1981.2After its position, the market rose strongly and reached its highest point on the weekly chart2049After the position of the market rose and reorganized, the market was significantly affected by fundamental speeches and technical profit taking on Friday, and the end of the week was finally closed2004.1After the position is adjusted, the circumference is wrapped in a long inverted hammer head shape with an upper shadow line, and after such a shape is closed, the circumference shape has a certain amount of pressure.
Gold from1From an hourly level perspective, gold surged last Friday2047After losing momentum on the first line, it gradually broke through the moving average and mid track support during the day, and hit the bottom track support to stop the decline. It once again moved a range between the upper and lower tracks, as long as the price remains stable1990If there is support near the lower track of the first line, then the recent fluctuating upward pattern will not be disrupted. This week, gold will once again turn upward on the support of the lower track, and the current opening of the Bollinger Belt will turn upward to flat,5Under the moving average10The dead cross of the moving average moves downwards, and the short-term pressure moves downwards to2012-2015Nearby, sub image indicatorsMACDThe fast line turns downwards, while the slow line does not show any significant changes. The green bar directly measures to the bottom, while the agility indicator runs down from the overbought area to the oversold area and then turns upwards. The indicator shows that gold is currently in a strong short position, but the space below may not be large. Therefore, in terms of operation, it is bearish and not chasing short. It will be empty after the rebound correction. Overall, Song Yiyang suggests that in the short-term operation of gold today, the main focus should be on rebounding and short selling, supplemented by a pullback and long selling, with a focus on short-term trading above2017-2020Frontline resistance, short-term focus below1990-1987Frontline support.
Golden Operation Strategy:
Lower Touching1990—1993Long nearby, stop loss1986, Objective2009-2012Nearby. Up close2015—2017Short nearby, stop loss2023, Objective1998reach1995。
【4.17crude oilMarket Trend Analysis
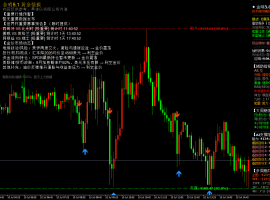
US crude oil last Friday(4month14In the Asian market, the market remained mostly fluctuating back and forth, with mixed ups and downs; In the US market, crude oil expanded its gains and hit intraday highs83.06dollar/The barrel unfolds downward and reaches its intraday low81.72dollar/Recovery after barrel, as of closing, closing at82.68dollar/Bucket.
From the perspective of crude oil technology, on the daily line, crude oil fluctuated back and forth last Friday, recording a small positive. On the daily line, currently crude oil is trading sideways at high points and overbought in the short term, so be cautious of falling back;4On an hourly basis, crude oil was trading near the medium track last Friday, but after a slight increase in the evening, it fell. Currently, the Bollinger Belt is about to open,MAMoving forward from the moving average to the third line,KDJRandom indicators with three lines up,MACDThe green kinetic energy column of the indicator is increasing, and the fast slow line has a dead fork downward. Overall, crude oil still has a downward trend in the short term, and the gap has not been filled. It is recommended to rebound within the day83.0-83.5Short the resistance nearby.
Author/Song Yiyang
(Note: The above article was written by the team of Song Yiyang. Please indicate the source when reprinted. It is a warm reminder that there are risks in investment and caution should be taken when entering the market. The article has a lag, and due to differences in platform locations and delays in online publishing, the above analysis does not provide specific entry points. Operational suggestions are for reference only. Please do your own risk control.)
|
"Small gifts, come to Huiyi to support me"
No one has offered a reward yet. Give me some support
|

 7month10日午后黄金策略:金价回落至411
目前消息面对黄金还是偏压制。市场对美国利率继续维持高位、甚至进一步收紧的预期有
7month10日午后黄金策略:金价回落至411
目前消息面对黄金还是偏压制。市场对美国利率继续维持高位、甚至进一步收紧的预期有
 ZFX山海证券:金价惊险重返4100dollar
7month9日,国际黄金市场上演了一场惊心动魄的逆转大戏。在经历了连续三个交易日的下跌之
ZFX山海证券:金价惊险重返4100dollar
7month9日,国际黄金市场上演了一场惊心动魄的逆转大戏。在经历了连续三个交易日的下跌之
 ZFX山海证券:金价坚守4000Pass!
Wednesday(7month8日)现货黄金价格一度跌至4020美元附近,油价应声暴涨逾5%,刷新逾两周高点
ZFX山海证券:金价坚守4000Pass!
Wednesday(7month8日)现货黄金价格一度跌至4020美元附近,油价应声暴涨逾5%,刷新逾两周高点
 7month9日早上黄金策略:金价深V反弹后
昨晚黄金走了一波急跌,盘中一度逼近4020关口,随后展开深V反弹收复大部分跌幅,最
7month9日早上黄金策略:金价深V反弹后
昨晚黄金走了一波急跌,盘中一度逼近4020关口,随后展开深V反弹收复大部分跌幅,最
 ZFX山海证券:金价被油价大涨压制!
Tuesday(7month7日),油价大幅飙升,现货黄金当日下跌1.42%, receive reports per ounce4105美元,盘中一
ZFX山海证券:金价被油价大涨压制!
Tuesday(7month7日),油价大幅飙升,现货黄金当日下跌1.42%, receive reports per ounce4105美元,盘中一


 Riser card
 Top card
 Silence card
 Color changing card
 lifting jack