Register now, make more friends, enjoy more functions, and let you play in the community easily.
You need Sign in Can be downloaded or viewed without an account?Register Now 
x
【goldTrend Analysis
Analysis of gold news: Thursday(3month16day)Due to the latest actions taken by the government to curb the worsening banking collapse, which failed to prevent a new round of decline in global stock markets, gold prices have risen again. In the early morning trading of the US market, spot gold continued its upward trend and hit a new daily high1933.53The US dollar rebounded from a lower session27USD. The gold price is currently at1916dollar/Around ounces. Just as investors are focusing on Credit Suisse, some analysts point out that they are currently rebuilding their long positions in gold. The financial markets have sent a clear signal that Wall Street's loudspeakers are calling for a possible pause in interest rate hikes next week, indicating an increased likelihood of a decline in the US dollar. Due to the past week at Silicon Valley Bank(SVB)、Signature BankAs regional banks in the United States continue to experience thunderstorms, leading to broader financial turmoil, more investors are anticipating that the Federal Reserve's interest rate hike cycle may come to an end.
Gold Trend Analysis
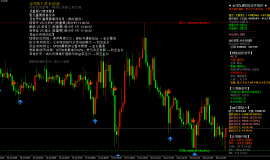
After the appearance of a cross star line at a high level yesterday, there have been signs of adjustment again in technology. In the short term, we will continue to focus on the following areas5Daily line1915Nearby competition, if lost today or early next week, there may be a wave of spatial adjustments in gold technology. But the problem is that the current main rhythm of gold is still controlled by fundamentals, and the main driving force for the rise is still the risk aversion caused by unexpected events. If the risk aversion is weakened or even negative news appears, then gold can have the possibility of a correction and adjustment.
DayKCross ending, on the one hand, the market is temporarily waiting for both bearish and bearish positions; At the technical level, the cross signal needs to be noted to be cautious of the correction of gold prices' rebound '; High cross, two-day trend, price pressure position1935-1940Here, so the watershed position for the second stage is1935-1940This position interval, upper break1940The position will further elevate the operation; Unbreakable1940The pressure position can only temporarily enter a high volatility trend.
After the continuous upward trend of the gold daily line, it remained at a high and volatile level in the previous trading day4Continuously rising and falling in the hourly trend, currently under temporary pressure1935There is currently a certain degree of deviation in the areaKThere are also signs of the line gradually falling below the short-term moving average, tending to make some adjustments in the short-term trend. The current trend of interval compression in the hourly level is relatively small, and the technical form is gradually weakening. In the short term, pay attention to it1918The support of the area. In terms of operational thinking, Song Yiyang suggests that gold should be bullish on dips;
Golden Operation Idea: Suggest Callback to1923Multiple participation, stop loss1915, look at the goal1940-48;
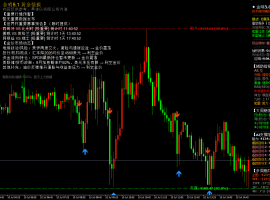
crude oilTechnical analysis; Yesterday's crude oil volume broke through the low and fell, breaking the recent downward trend of the range. As mentioned yesterday, once the wide range of fluctuations breaks, it will accelerate. And yesterday it was given72.30Short selling, with the highest accuracy to72.50Directly break under pressure70.0Low point, lowest to65.70.Set the largest decline within next week and also hit a new low in the near future, breaking the volatile range, with a continuous negative day and a large negative day. The trend bears remain unchanged,4The hourly chart breaks through the previous range of fluctuations, but due to the large fluctuation base, there are signs of gradual release. It is uncertain whether the sustainability of the future space will further continue the weak downward trend or turn into a correction of volatility. Rhythm is more important, attached pictureKDThe indicator has entered the oversold area and needs to be corrected. The trend is still empty, but the fluctuation base is large, and the rebound will also be relatively large, which is easy to wash away. The hour chart is temporarily under pressure near the mid track, and the Asian session rebounded briefly once. Look at the low point of the second pullback, as for whether it can break through the low point and determine the space for continuity. The fluctuation base is large, and there is a high probability of ultra short term fluctuations. The focus is on grasping the entry point. Overall, Song Yiyang suggests that the main operating strategy for crude oil today is to rebound from high altitude, supplemented by stepping down more, with short-term attention from above70.0-71.0Frontline resistance, short-term focus below65.0-64.0Frontline support
Author/Song Yiyang
My Interpretation of World Economic News,Analyzing the Global Investment Trends,Has in-depth research on commodities such as crude oil, gold, silver, etc,Technical Director Song Yiyang explains a set online,Loss recovery,One on one real-time guidance due to network push latency,The above content is personal suggestion,Due to the timeliness of online publications,For reference only,At one's own risk,Please indicate the source for reprinting.
|
"Small gifts, come to Huiyi to support me"
No one has offered a reward yet. Give me some support
|

 7month10日午后黄金策略:金价回落至411
目前消息面对黄金还是偏压制。市场对美国利率继续维持高位、甚至进一步收紧的预期有
7month10日午后黄金策略:金价回落至411
目前消息面对黄金还是偏压制。市场对美国利率继续维持高位、甚至进一步收紧的预期有
 ZFX山海证券:金价惊险重返4100dollar
7month9日,国际黄金市场上演了一场惊心动魄的逆转大戏。在经历了连续三个交易日的下跌之
ZFX山海证券:金价惊险重返4100dollar
7month9日,国际黄金市场上演了一场惊心动魄的逆转大戏。在经历了连续三个交易日的下跌之
 ZFX山海证券:金价坚守4000Pass!
Wednesday(7month8日)现货黄金价格一度跌至4020美元附近,油价应声暴涨逾5%,刷新逾两周高点
ZFX山海证券:金价坚守4000Pass!
Wednesday(7month8日)现货黄金价格一度跌至4020美元附近,油价应声暴涨逾5%,刷新逾两周高点
 7month9日早上黄金策略:金价深V反弹后
昨晚黄金走了一波急跌,盘中一度逼近4020关口,随后展开深V反弹收复大部分跌幅,最
7month9日早上黄金策略:金价深V反弹后
昨晚黄金走了一波急跌,盘中一度逼近4020关口,随后展开深V反弹收复大部分跌幅,最
 ZFX山海证券:金价被油价大涨压制!
Tuesday(7month7日),油价大幅飙升,现货黄金当日下跌1.42%, receive reports per ounce4105美元,盘中一
ZFX山海证券:金价被油价大涨压制!
Tuesday(7month7日),油价大幅飙升,现货黄金当日下跌1.42%, receive reports per ounce4105美元,盘中一


 Riser card
 Top card
 Silence card
 Color changing card
 lifting jack