Register now, make more friends, enjoy more functions, and let you play in the community easily.
You need Sign in Can be downloaded or viewed without an account?Register Now 
x
goldLatest market analysis:
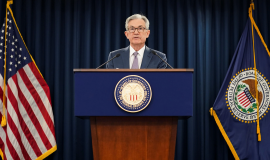
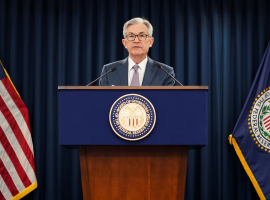
Analysis of Gold News: Wednesday(10month26day)In the early morning trading of the Asian market, spot gold slightly declined in the short term, and the current gold price is trading1650dollar/ounce. Due to investors betting that the Federal Reserve will12The pace of interest rate increase from January will slow down, and the yield of US dollar and US treasury bond bonds will fall back. The gold price on Tuesday(10month25day)Received a boost and closed higher. In late US trading, spot gold closed higher1652.95dollar/Ounces, slightly up3.74USD or0.23%, highest daily contact1662.23dollar/Ounces, lowest touch1638.14dollar/ounce. At present, the decline of the US dollar against a basket of currencies has provided support for the gold price denominated in US dollars. Intraday decline in the US dollar index0.96%, to110.91。 A weak US dollar often supports demand for commodities priced in US dollars. As the US dollar weakens, gold prices reverse their earlier decline and instead rise, and investors are currently closely monitoring any clues about the Federal Reserve slowing the pace of interest rate hikes.
Investors should note that compared to other currencies such as the euro, pound sterling, and yen... gold has performed well and maintained its hedging role. For example, this year, gold remains a hedging tool, while the yen has plummeted to the point where the Bank of Japan has intervened multiple times to support the yen, but the results have been mixed. The fall in the yield of US treasury bond bonds also boosted the gold price,10Yields of one-year treasury bond bonds fell nearly13Points, to4.099%。 Compared with government bonds that are considered safe, declining bond yields can reduce the opportunity cost of holding gold. Market Reduction for the Federal Reserve12Monthly interest rate hike75With a basis point expectation, US bond yields have slightly declined, providing support for gold prices, but the market expects the European Central Bank to raise interest rates at a high probability this week75Basis points, expected to be released this week in the third quarter of the United StatesGDPWill increase year-on-year2.1%, USA9monthPCEIt will also be in a high position, causing bulls to have concerns. On this trading day, there is relatively little economic data, with a focus on the EU's Energy Ministers' Meeting, speeches by ECB officials, speeches by Bank of England officials, and news related to the new UK Prime Minister. Pay attention to the geopolitical situation.
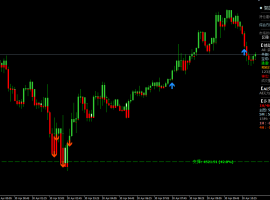
Technical analysis of gold: Gold daily level1614Nearby double bottoms support, and the morning star appears in the form of a double bullish signal. Therefore, the operation is mainly to buy long on dips, using double bottoms as stop losses to buy long and look up, and paying attention to the trend line (connecting the previous two high points) pressure above1690-1695Nearby resistance. This is what we have emphasized before. gold4From an hourly level perspective, gold rose and fell yesterday, with a high level ending in a twilight star pattern. However, the intraday market did not continue well, and the price was an important support in the early stage of hitting1640The narrow horizontal oscillation above. A typical way of trading time for space.KAt present, the line is continuously crossed with stars, and there has been a prolonged stalemate in the long air. There is a risk of dishwashing, and special caution is needed in operation. In the short term, look more and move less, and in terms of thinking, focus mainly on low and high.
From a structural perspective, gold still has two waves of rise in the short term. Yesterday, it started to stabilize and has a trend of rising again in the short term. On the contrary, if the low level was recovered yesterday. So the rebound is just a flash in the pan, with insufficient sustainability. At present, after stepping back, there is a certain degree of persistence when it starts to stabilize and then goes up, which may cause it to break up1670。1The hourly chart is currently being compiled and will be explored the next day1637The low point has rebounded again, providing a clearer understanding of the underlying buying support, and the strength of the rebound is also considerable,MA5—MA10The moving average is expected to form a golden cross trend, so the operation is mainly based on adjusting back and entering more. Overall, it is recommended that the short-term operation of gold today should focus on a pullback and long selling, supplemented by a rebound and short selling, with a focus on short-term trading above1670-1675Frontline resistance, short-term focus below1649-1644Frontline support.
crude oilTrend analysis:
The crude oil fluctuated in the range on Tuesday without forming a clear trend, and the market has temporarily fallen into a state of volatility. Currently, it is under temporary pressure near the upper edge of the range and may step back and run downwards again.At present, there is a fluctuating trend in the range, with a three wave structure appearing both downward and upward. Therefore, as long as86If it is not broken, there is a high probability that it will run within a certain range within the day. According to the update of the Wave Trading System, crude oil has entered a new roundBwavecWe can't confirm it safely yet, unless we're on the station86Only then can the uplink space be opened, and the main idea for interval operation is temporarily.1The hourly moving average indicators are scattered and disorderly, and if they cannot move out of one side in the short term, they will remain fluctuating within the range. Blocking the interval is more crucial than direction in operation, waiting for the organization to break the deadlock. In summary, it is recommended to focus on short-term operations for crude oil today86.0-87.0Frontline resistance, short-term focus below82.2-82.0Frontline support. Short term operation during the day,Real offer at current price!
Analysis of silver trend:
The significant decline in silver on Tuesday led to the view that the market was once again bearish, but at a critical moment, bulls regained all their losses and the market still attempted to rebound upwards. Therefore, we will continue to look at the reaction to previous high pressure in the day. Yesterday, I stepped back on the platform19.00Short break, but recapture lost ground again under the counterattack of multiple heads, indicating a break19.00The formation is only a false trend. According to the update of the wave trading system, silver is currently experiencing a broad fluctuation trend at the bottom, with a short-term trend of three wavesABCLook at the rebound. Intraday pressure19.70——20Supported on19.17——19。 Silver operation is recommended to continue at19.17Buy, risk control19.01, Objective19.70——19.90——20.05。
|
"Small gifts, come to Huiyi to support me"
No one has offered a reward yet. Give me some support
|

 ZFX山海证券:金价延续下跌,4500beautiful
Wednesday(4month29日)现货黄金价格延续了近期的颓势,跌幅高达1.17%,最终收报于每盎司4543
ZFX山海证券:金价延续下跌,4500beautiful
Wednesday(4month29日)现货黄金价格延续了近期的颓势,跌幅高达1.17%,最终收报于每盎司4543
 2026year4month30日:美联储鹰派按兵不动
昨天市场焦点全在美联储4月议息会议。结果不出所料,利率维持在3.5%-3.75%不变,但内
2026year4month30日:美联储鹰派按兵不动
昨天市场焦点全在美联储4月议息会议。结果不出所料,利率维持在3.5%-3.75%不变,但内
 Aurra Markets:【美元兑日元走势分
日本会否捍卫美元兑日元的160Gateway? 美元兑日元正逼近市场高度关注的 160.00 key
Aurra Markets:【美元兑日元走势分
日本会否捍卫美元兑日元的160Gateway? 美元兑日元正逼近市场高度关注的 160.00 key
 Aurra Markets:沃什获提名执掌美联
凯文·沃什获提名是否预示美联储政策范式转变在即? 美国总统特朗普总统提名凯文·
Aurra Markets:沃什获提名执掌美联
凯文·沃什获提名是否预示美联储政策范式转变在即? 美国总统特朗普总统提名凯文·
 2026year4month30day10:58 金价低位震荡 back
当前现货黄金报价约4563dollar/盎司,亚市早盘呈现弱势反弹格局,但整体仍处于空头主
2026year4month30day10:58 金价低位震荡 back
当前现货黄金报价约4563dollar/盎司,亚市早盘呈现弱势反弹格局,但整体仍处于空头主


 Riser card
 Top card
 Silence card
 Color changing card
 lifting jack