Register now, make more friends, enjoy more functions, and let you play in the community easily.
You need Sign in Can be downloaded or viewed without an account?Register Now 
x

One of the three theoretical foundations of technical analysis: history repeats itself. If a specific structure appears and the future market always experiences similar fluctuations, then that specific structure can serve as a trading signal. This specific structure can be obtained through historical data statistics of a single variety, cross validation of multiple varieties, or a summary of some experience (such as wave theory). In the past two years, there has been a trend of replicating historical trends in international gold prices.
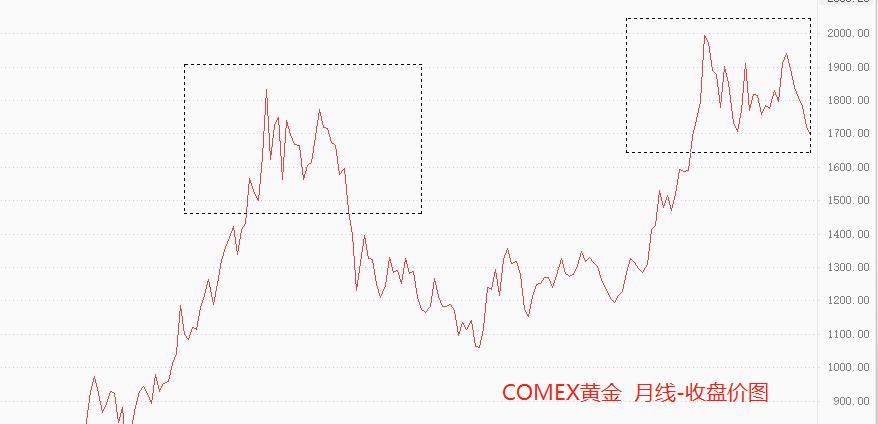
2011year8Month,COMEXgoldSet a new historical high1917The US dollar then began to fluctuate and decline, reaching2012year5Monthly drop to1526The US dollar gained support and rose again.2012year9Month reaches second highest point1790The US dollar then began a three-year downward trend. set a new record-Callback-Bounce to sub high point-Long cycle decline, which is known as the 'double top' pattern in the field of technical analysis/Step back confirmation is a typical feature formed at the top.

2020year7Month,COMEXGold has risen to a historic high2005The US dollar then began to fluctuate and decline,2021year3Month hits support level1673The US dollar rebounded after stopping its decline. this year3Although the month broke through during the session2005And set a new historical high2078USD, but ultimately closing at1942USD. set a new record-Callback-Bounce to sub high point-The pattern of long-term decline is significant. From the closing price line graph,2020year7The trend from the month to the present, a perfect replica2011year8Month to2012year9The trend structure of the month. According to the theory of 'history will repeat itself', gold prices will continue to decline significantly over the next three years.
In addition to technical signals, the macro level also supports the conclusion of bearish gold. US shares8Monthly CoreCPIData from5.9%Jump up to6.3%Declare the inflation inflection point theory bankrupt. The Federal Reserve is in a state of aggressive interest rate hikes, and as long as the economy shows no signs of recession, its pace of rate hikes will not stop. The US dollar index has already broken through110At the checkpoint, although in an overbought state, there is not enough bearish news to make it fall. The international gold price and the US dollar index are in a seesaw relationship, and a stronger latter is bound to weaken the former. In recent months, the international gold price has repeatedly broken through1700It is a manifestation of lack of confidence among bulls.
Affected by the Federal Reserve's interest rate hike, the US dollar index is highly likely to surge to120Gateway. Once a trend is formed, it is difficult to change. In the long run, the starting point of the US dollar index is2008year3In the month of, the price at that time was71.80. During this period, there were two broad oscillation type pullbacks, and after each oscillation ended, a new round of unilateral upward trend would start. Considering that2020After the outbreak of the pandemic in, global central banks, represented by the Federal Reserve, adopted extreme loose monetary policies, so it is reasonable that the rise of the US dollar index in this round has created an extremely high price.
ATFXThe analyst team's concise view: Under the strong state of the US dollar index, it is difficult to say how international gold will rise.
*Risk Tips and Disclaimers*
There are risks in the market and investment should be cautious. The above contents only represent the views of analysts and do not constitute any operational recommendations.
2022-09-15
|
"Small gifts, come to Huiyi to support me"
No one has offered a reward yet. Give me some support
|


