Register now, make more friends, enjoy more functions, and let you play in the community easily.
You need Sign in Can be downloaded or viewed without an account?Register Now 
x
Fundamentals:
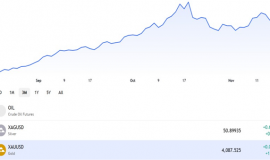
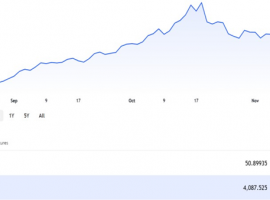
Friday(4month17day)goldPrice from1718The area is starting to drop to its lowest point nearby1678Nearby, the daily chart closes with a bearish candlestick.
Today's data
No important data
Technical aspect:

On the weekly chart, the long upper shadow cross star of the weekly closing band is currently running above the short-term line,5Zhou and10The weekly moving average crosses upwards, while the medium-term moving average crosses upwards,MACDRun up,KDJMoving upwards, the indicator is bullish. The Golden Week broke through last week1700Pass, the highest surge to1748Nearby, but quickly blocked within the week and began to decline, closing below1700At the critical point, there are signs of a short-term reversal and a pullback, but the short-term support below is still evident. Stay tuned5Zhou and10The weekly moving average is supported by1650Nearby and1620Nearby, and1600If there is support at the checkpoint, then the weekly correction should focus on these support positions. Once it stabilizes, it may still rise, but the height of the rise cannot be determined. It may only touch the support and rebound. After the rebound, it may continue to fall. If it maintains its strength after the rebound and continues to rise for several consecutive days, it should still be a long position. However, soon after the rebound, it will fall again and hit a new low. The weekly line will continue to adjust for a period of time, and the time can be seen4At the end of the month, which means either there will be fluctuations and adjustments4At the end of the month, either stabilizing after reaching support or rebounding with fluctuations and rising to4At the end of the month, it is possible to look at the weekly chart, but the daily chart is more bearish.

On the daily chart, the gold daily chart closed at a bearish candlestick and is currently running below the short-term chart,5Japan and Japan10The daily moving average is flat and glued, while the mid-term line is flat and glued,MACDSmooth bonding,KDJRunning downwards, the indicator direction is not clear. The previous wave of gold appreciation1450Up to last week's high point1748Nearby, the increase is close to300The US dollar is approaching the limit of its previous year's increase, as seen in this way1748The nearby and above areas are likely to become the top of this year, which means that even if there is still room above, it is difficult to expect much further increase. Instead, the top of this year can be seen at any time, and once adjusted, it will be100-200The risk of the US dollar space should not be underestimated. Of course, due to the impact of the epidemic this year, if you want to turn short, you still need to wait for the turning point of the epidemic. Only after the turning point appears will there be no limitQEOnly then can it stop and loose liquidity weaken, so that gold can emerge from a sustained pullback, otherwise a pullback will occur100The US dollar may still stabilize and continue to rise, of course, it has been mentioned1748The top area is nearby and above, so it is expected to be in the future1-2Maintain for a month1600-1748The probability of fluctuations between them is high, and then waiting for the epidemic to gradually control and reach a turning point before gold can truly begin to rebound and fall. Therefore, it is very likely that in terms of time6From the beginning of the year to the beginning of the month, in terms of time cycle3Gold is showing a clear upward trend in the month, entering into3A wave appeared after the month1700-1450Great plunge, but due to insufficient liquidity, unlimited in the Federal ReserveQEAfter providing sufficient liquidity, gold began to soar and even broke through1700Pass, this indicates3After the month, it is not a downward trend, but currently it cannot be completely said to be an upward trend. From a spatial perspective, it is a large-scale fluctuation, which means3The overall fluctuation from month to now is actually a super large range, but the fluctuation space is too large. It appears to be a trend market in a shorter period, but if you take a step back, it is a range fluctuation. So12Month to3month3The period of one month is on an upward trend,3month-6The month should be a volatile market, but there is a lot of room for it. Wait until6A new trend market will only appear after the month, and it is likely that the epidemic has reached a turning point. As mentioned before, once the epidemic reaches a turning point, gold will fall6After the month, gold is likely to follow a downward trend, and it will emerge from a sustained pullback trend, no longer bouncing back and forth without a real direction. This is the rhythm that needs to be noted in the mid-term of the future.
Short term looking to soar1748After being blocked and continuously adjusted, last Friday's bearish candlestick line has now fallen below the short-term line, and the short-term line has begun to level and bond. The medium-term line is also flat and bond, indicating that the medium-term direction is not obvious. This provides space for downward adjustment and reduces support. As long as the daily line cannot regain its stability near the short-term line in the next few days, but oscillates downward near or below the short-term line, there is no suspense about the basic decline. In fact, it is highly likely that a wave of adjustment will be carried out at present, and support should be paid attention to1660-1640-1620And then1600At the critical level, the support level is not suitable for short selling. If it stabilizes, you can try to go long. In the short term, the market is still dominated by high prices. Focus on it today1680-1690Pressure, as long as it doesn't break through1700Standing firm and being hindered from rebounding is a high-altitude opportunity.(Band Midline Trading Opportunity Reminder:1680-1700Layout empty orders, target1660-1640-1620)
pressure1680-1690-1700-1720-1750-1800
brace1660-1650-1640-1620-1600-1570-1500-1450-1400-1350
Spot gold:
1. 1645-1655Long light position, stop loss1639, Objective1670-1680-1690-1700
2. 1680-1690Short selling, stop loss1705, Objective1660-1640-1600-1570-1550-1500 |
"Small gifts, come to Huiyi to support me"
No one has offered a reward yet. Give me some support
|


 ZFX山海证券:金价冲高回落!多空鏖
Wednesday(2month4日)黄金市场上演了一出惊心动魄的“过山车”行情,现货黄金在周三盘中早些
ZFX山海证券:金价冲高回落!多空鏖
Wednesday(2month4日)黄金市场上演了一出惊心动魄的“过山车”行情,现货黄金在周三盘中早些
 How to buy gold investment?2025Novice Lazy Bag:6
In today's uncertain global economic outlook and inflationary pressures, many people are seeking safe havens that can safeguard asset values. “
How to buy gold investment?2025Novice Lazy Bag:6
In today's uncertain global economic outlook and inflationary pressures, many people are seeking safe havens that can safeguard asset values. “
 goldUSD解析:报价、投资管道与美元
Are you curious about the glittering gold market, yet always caught off guardXAU/USD」这串神秘代码搞得晕头转向
goldUSD解析:报价、投资管道与美元
Are you curious about the glittering gold market, yet always caught off guardXAU/USD」这串神秘代码搞得晕头转向
 2026What are the legitimate gold investment software for the year?
2026The intensification of global economic fluctuations in the year has highlighted the safe haven and preservation properties of gold speculation, attracting a large number of investors to enter the market
2026What are the legitimate gold investment software for the year?
2026The intensification of global economic fluctuations in the year has highlighted the safe haven and preservation properties of gold speculation, attracting a large number of investors to enter the market
 2026London Gold's official platform ranking has been released! Six major holdings
With the intensification of global economic uncertainty, frequent geopolitical conflicts, and sustained high inflation pressure, London gold has become a classic
2026London Gold's official platform ranking has been released! Six major holdings
With the intensification of global economic uncertainty, frequent geopolitical conflicts, and sustained high inflation pressure, London gold has become a classic


 Riser card
 Top card
 Silence card
 Color changing card
 lifting jack