Register now, make more friends, enjoy more functions, and let you play in the community easily.
You need Sign in Can be downloaded or viewed without an account?Register Now 
x
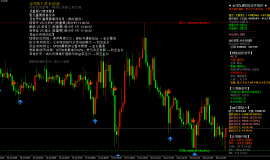
goldOn the one hand, the continuous escalation of the epidemic will continue to provide support for bullish gold for a long period of time. However, the current risks that need to be paid attention to are short-term selling caused by lack of liquidity, as well as short-term profit taking after the high rise of gold prices, which will provide opportunities for short-term downward correction of gold prices; From the recent overall strong trend of gold and the continuous occurrence of short-term super40The deep decline above the US dollar has already demonstrated the recent market shock pattern, so it is once again reminded that traders should not blindly pursue orders in their operations. crude oilOn the one hand, the oil price war has not truly eased, so oil prices remain unpredictable. However, yesterday's price test28There is significant significance in the vicinity of the US dollar, which is2014The technical support provided by Saudi Arabia's crackdown on shale oil prices at the beginning of the year may temporarily halt bearish attacks and bring some rebound, but after that, it is highly likely to provide new sniper opportunities for bears. In terms of the foreign exchange market, the current epidemic continues to escalate in the United States, and the US stock market has initiated a circuit breaker mechanism. The US dollar has temporarily lost its hedging function, and this factor will adjust the weak trend of the US dollar for a long time. However, due to the deep decline in the market, the US side has begun to take action, and today is special. Lang. Pu. Holding a press conference on economic stimulus measures may not be helpful, but it may provide an excuse for a rebound in the market after oversold and help the US index rebound in the short term, while also causing non US gains to recoup; Although economic data in Europe remains weak and there may be opportunities for a short-term downturn, the focus of the market will still be more on the United States, which will bring an overall upward trend to European currencies; The spread of panic in commodity currencies has suppressed short-term buying, but there may be a rebound after the sentiment tends to calm down.
Data source:MEX Markets
brace1 : 1671 brace2: 1651 resistance1 : 1706 resistance2: 1711 Hedging will overall keep the market enthusiastic about the upward trend of gold, but currently the biggest risk for gold is the potential selling risk caused by the lack of liquidity in the market; In addition, the current market is already concerned about the Federal Reserve3Interest rate reduction within the month75The expectation of one basis point has been digested, and it is not ruled out that the gold price will be adjusted to prepare for a subsequent rebound. Technically priced at2month5Starting from the day of expansion100%If pressure falls back and needs to be maintained2month28The recent rise needs to stabilize above the trend line, otherwise the price may start falling from yesterday's gold priceABCRevise the trend and temporarily focus on the red segmentation line below38.2%。
Data source:MEX Markets
brace1 : 31.0 brace2 : 28.0
resistance1:38.8 resistance2:44.0
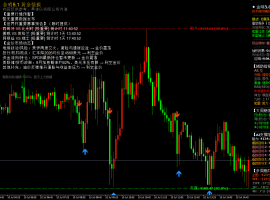
At present, the fundamentals are mainly focused on the oil price war initiated by Saudi Arabia, which may trigger competition among oil producing countries to increase production, and may lead to a deep collapse of oil prices, resulting in an overall main decline. However, under unconventional fundamentals, it may cause market price shocks. Traders should focus on controlling risks and act within their capabilities.
Technically, prices have lost their technical significance in the short term. Traders can use spatial calculation structures as a reference for resistance support28The vicinity of the US dollar is2016At the annual low point, this is Saudi Arabia's2014The technical support provided during the suppression of shale oil at the beginning of the year poses a high risk of short-term rebound.
Data source:MEX Markets
brace1:1.1357
resistance1:1.1513
The decline of the US dollar index is the main factor contributing to the recent rise of the euro, and it is expected that the euro may maintain its upward momentum under the continued weakness of the US index; Currently, the market has already lowered interest rates against the European Central Bank10The expectation of one basis point has been digested, and if the European Central Bank's easing falls short of expectations, it may limit the short-term rise of the euro.
Technically, the euro is temporarily viewed through the Elliott wave theory channel. Yesterday, the price broke through the red channel and then fell under pressure, extending the purple channel trajectory. If it breaks through the purple channel, it will hope to enter a true downward correction trend. Otherwise, the price will be at the expansion line61.8%to100%Horizontal correction of the interval.
Data source:MEX Markets
brace1:1.3025 brace2:1.2968
resistance1: 1.3210
Due to the temporary digestion of the negative impact of the UK Europe negotiations, a harmonious negotiation atmosphere emerged between the UK and Europe last week. The pound brought some support, but the short-term rebound of the US dollar index may temporarily limit the pound's rise.
Technically, the overall trend tends to be bullish. Yesterday's price compared to last year12month13The trend line formed from the beginning of the day suppresses and breaks in the short term, but the daily level is still successful in stabilizing. In the short term, the trend is focused on the downward momentum of the segmentation line, and the price is still seen as attempting to break through this trend line in the future.
Data source:MEX Markets
brace1:101.10
resistance1:103.65 resistance2:105.20
Until now, the Japanese yen remains one of the few classic safe haven assets. Under the current panic, safe haven funds are seeking entry points to boost the strength of the yen; Due to the spread of the epidemic in the United States and the lack of satisfactory epidemic control measures by the United States, the US dollar continues to weaken, accelerating the appreciation of the yen. This factor will still keep the yen relatively strong overall.
Technically, the US and Japan still lean towards a bearish pattern, but tested yesterday2014Year and Year2016Near the overlapping low points of the year, there is a risk of stopping the decline in the short term. For the time being, we will view it as a low level oscillation. Therefore, in the short term, we can intervene in the rebound of long positions by dividing the line pressure target, and the long position target should not be too large.
Data source:MEX Markets
brace1:0.6514 brace2 : 0.6435
resistance1:0.6640 resistance2 : 0.6776
Affected by the pandemic and the Saudi oil price war, global panic has skyrocketed, with commodities being sold off wildly as risk assets, and the Australian dollar, as a commodity currency, also experiencing some pressure.
Technically priced at2018year9month30The support line starting from today rebounded as scheduled, and we had originally expectedAAfter a rebound or appearanceBThe downward trend of the segment, although it achieved a decline yesterday, the magnitude was too large, to the extent thatABCThe rebound structure has been disrupted, and a new rebound structure will be constructed for prices in the future. Therefore, there is still room for downward momentum in the short term. Traders can first look for a pullback before engaging in long low positions.
Data source:MEX Markets
resistance1 : 0.6447
brace1:0.6277 brace2 : 0.6170
Affected by the pandemic and the Saudi oil price war, global panic has skyrocketed, with commodities being sold off wildly as risk assets, and the Australian dollar, as a commodity currency, also experiencing some pressure.
Technically, the rapid decline of the New Zealand dollar yesterday also disrupted the rebound structure since last week. The next step is to see prices rebuild the rebound structure. In the short term, there is a demand for a pullback and energy storage, which can be left empty before looking for more opportunities.
Data source:MEX Markets
brace1 : 1.3571
resistance2:1.3730
The Saudi oil price war may lead to a collapse in oil prices, and the Canadian dollar is the first currency to be affected. If oil prices continue to decline, the Canadian dollar will continue to weaken in the future.
Technically, the exchange rate between the US dollar and the Canadian dollar is2month21Starting from the day of the rise and expansion161.8%Positional pressure, there is a need for technical repairs in the short term, and within the day, the main focus will be on161.8%-100%Looking at interval correction, after breaking through, multiple orders can also be followed up.
Data source:MEX Markets
brace1:0.9188
resistance1:0.9438
Against the backdrop of the continued weakness of the US dollar index, the safe haven function of the Swiss franc has returned, and this factor will still lead to the appreciation of the Swiss franc as a whole; But in the short term, the US dollar may face a rebound correction that may limit the appreciation potential of the Swiss franc.
Technically, the US dollar against Swiss franc has been successfully tested2019year12Monthly expansion line161.8%Supporting and rebounding may indicate a temporary suspension of the downward trend. Next, we will look at the technical correction of the previous decline in the market, with a focus on the segmentation line above38.2%, also for expansion lines100%Pressure position.
| Hong Kong Hang Seng Index) |
Data source:MEX Markets
brace1:24785 brace2:23688
resistance1:26025
The current global stock market is generally pessimistic, and Hong Kong stocks are under significant synergistic pressure as a result. However, if the gradual improvement of the COVID-19 situation in China drives a positive trend in the domestic stock market, it may give Hong Kong stocks a good opportunity for long positions.
The rebound in the downward trend of technology, with prices currently in a state of decline2019year1month20RecentlyABCIn the downward trend, the price downward test was completed yesterdayAB=CDThe structure shows signs of stopping the decline, and the short-term rebound correction trend can be seen, but it has officially fallen below24785Will continue to test downwards4month25Starting from the day, the downward expansion line100%Location.
| Focus on financial information/event |
Note: ★ represents importance
09:00 New Zealand Federal Reserve Chairman Orr delivers a speech on monetary policy ★★★★
09:30 China2monthCPIthe annual rate ★★★★
15:45 France1Monthly industrial output rate ★★★★
16:00 China2monthM2Annual rate of money supply ★★★★
18:00 Quarterly employment rate in the Eurozone after quarterly adjustment in the fourth quarter ★★★★
Eurozone Q4GDPAnnual rate correction value ★★★★
U.S.A2monthNFIBSmall Business Confidence Index ★★★★Learn more in detailforeign exchangeKnowledge empowerment:eric9 |


 7month10日午后黄金策略:金价回落至411
目前消息面对黄金还是偏压制。市场对美国利率继续维持高位、甚至进一步收紧的预期有
7month10日午后黄金策略:金价回落至411
目前消息面对黄金还是偏压制。市场对美国利率继续维持高位、甚至进一步收紧的预期有
 ZFX山海证券:金价惊险重返4100dollar
7month9日,国际黄金市场上演了一场惊心动魄的逆转大戏。在经历了连续三个交易日的下跌之
ZFX山海证券:金价惊险重返4100dollar
7month9日,国际黄金市场上演了一场惊心动魄的逆转大戏。在经历了连续三个交易日的下跌之
 ZFX山海证券:金价坚守4000Pass!
Wednesday(7month8日)现货黄金价格一度跌至4020美元附近,油价应声暴涨逾5%,刷新逾两周高点
ZFX山海证券:金价坚守4000Pass!
Wednesday(7month8日)现货黄金价格一度跌至4020美元附近,油价应声暴涨逾5%,刷新逾两周高点
 7month9日早上黄金策略:金价深V反弹后
昨晚黄金走了一波急跌,盘中一度逼近4020关口,随后展开深V反弹收复大部分跌幅,最
7month9日早上黄金策略:金价深V反弹后
昨晚黄金走了一波急跌,盘中一度逼近4020关口,随后展开深V反弹收复大部分跌幅,最
 ZFX山海证券:金价被油价大涨压制!
Tuesday(7month7日),油价大幅飙升,现货黄金当日下跌1.42%, receive reports per ounce4105美元,盘中一
ZFX山海证券:金价被油价大涨压制!
Tuesday(7month7日),油价大幅飙升,现货黄金当日下跌1.42%, receive reports per ounce4105美元,盘中一


 Riser card
 Top card
 Silence card
 Color changing card
 lifting jack