"Small gifts, come to Huiyi to support me"
No one has offered a reward yet. Give me some support
| |
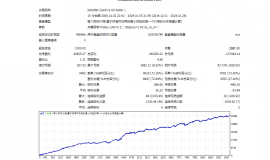
 【无敌黄金】一单一结
bookEAbyMT4平台专属现货黄金自动化交易程序,核心采用严格一单一结机制,同一时段仅持
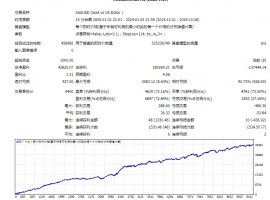
【无敌黄金】一单一结
bookEAbyMT4平台专属现货黄金自动化交易程序,核心采用严格一单一结机制,同一时段仅持
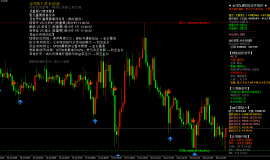
 7month10日午后黄金策略:金价回落至411
目前消息面对黄金还是偏压制。市场对美国利率继续维持高位、甚至进一步收紧的预期有
7month10日午后黄金策略:金价回落至411
目前消息面对黄金还是偏压制。市场对美国利率继续维持高位、甚至进一步收紧的预期有
 ZFX山海证券:金价惊险重返4100dollar
7month9日,国际黄金市场上演了一场惊心动魄的逆转大戏。在经历了连续三个交易日的下跌之
ZFX山海证券:金价惊险重返4100dollar
7month9日,国际黄金市场上演了一场惊心动魄的逆转大戏。在经历了连续三个交易日的下跌之
 ZFX山海证券:金价坚守4000Pass!
Wednesday(7month8日)现货黄金价格一度跌至4020美元附近,油价应声暴涨逾5%,刷新逾两周高点
ZFX山海证券:金价坚守4000Pass!
Wednesday(7month8日)现货黄金价格一度跌至4020美元附近,油价应声暴涨逾5%,刷新逾两周高点
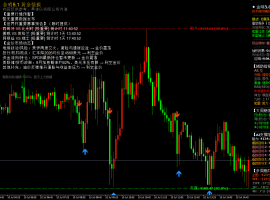
 7month9日早上黄金策略:金价深V反弹后
昨晚黄金走了一波急跌,盘中一度逼近4020关口,随后展开深V反弹收复大部分跌幅,最
7month9日早上黄金策略:金价深V反弹后
昨晚黄金走了一波急跌,盘中一度逼近4020关口,随后展开深V反弹收复大部分跌幅,最
MIP|Mobile version|A small dark room| |Site Map |customer serviceQQ:2381682638
Copyright © 2006-2024 Huiyi Interaction https://www.forexbbs.net copyright All Rights Reserved.


 Riser card
 Top card
 Silence card
 Color changing card
 lifting jack