Register now, make more friends, enjoy more functions, and let you play in the community easily.
You need Sign in Can be downloaded or viewed without an account?Register Now 
x
[paragraph]
Opportunities sprout amidst opposition, erupt amidst discussions, and shatter amidst cheers. The market is running, with trends emerging between long and short positions, and direction determined by ups and downs. A trend market is unlikely to end in a short period of time. If it ends quickly, it is not a trend at all. People often suffer from greed and want to seize the highest or lowest point in the market, which leads to missing the opportunity to enter while waiting for the best point. This is a problem that all investors have. I hope the following article can provide some help to you who have read this article.
goldTrend analysis:
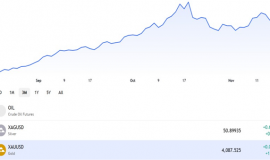
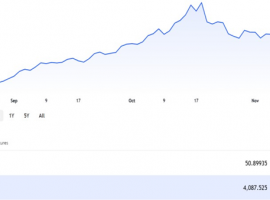
5month10On the day, international gold prices remained strong, supported by the escalation of trade tensions. Previously, US President Trump raised the price2000The implementation of tariffs on billions of dollars worth of Chinese goods exported to the United States is expected to lead to a weekly increase in gold prices. Beijing has stated that it will have to take countermeasures. But the rise in gold prices has been suppressed, while other safe haven assets such as the Japanese yen and Swiss franc have risen even more. To achieve a more sustainable upward trend, it is also necessary to see more fatigue in the overall financial market.
Technically speaking, the golden high point1291The key to determining whether the previous day's decline or market washing is due to gold breaking above this week1288At the checkpoint, the weekly price has already fallen compared to the previous periodKThe formation of the line pattern is disrupted, and now the key is to record a bullish candlestick on the weekly chart in order to form a yin-yang transition and provide more momentum for the bullish outlook in the future. from4Looking at the hourly trend, yesterday's bottom hit and rebounded, with the highest quote1288Today, the continuity showed weak consolidation. Considering today's Friday, we will control our positions and strictly implement the short-term moving average indicatorMA5Clearly worn underneathMA10The daily moving average is located at0Running below the axis, in accordance with the specifications in the attached diagramMACDDead fork volume,4Watch the fluctuating trend every hour.
From the trend of the hourly chart, it can be seen that the current hourly chart is in a triangular oscillation consolidation with intervals1281-1288As long as the range is maintained, both long and short positions will have profits, of course, it depends on how you trade. The stimulation of the US market news, the retracement of the US dollar's bearish candlestick, and the breakthrough of gold prices1285-1286Important points, the possibility of the market attempting to break new highs, but the good times do not last long. In an instant, the gold price fell back down again1285Running below, focus on gold prices in the short term1280Bottom support, relying on this line to continue looking up, although short-term moving average indicatorsMA5Clearly wornMA10The daily moving average is located at0Running above the axis, in accordance with the specifications in the attached diagramMACDThe golden cross continues to increase volume, and the hourly chart is optimistic about a volatile upward trend. Overall, the future operation will be wise and insightfulwdy6638My personal suggestion is to focus on long positions during a pullback, with a high rebound as a supplement. Attention needs to be focused on the top1290-1292Frontline resistance requires special attention below1276-1278Frontline support
Suggestions for Gold Operations:
1Callback1278-1280Long on the front line, stop loss4US dollars, look at the target1284-1286frontline
2Rebound1290-1292Short on the front line, stop loss4US dollars, look at the target1282-1284frontline
crude oilTrend analysis:
U.S.AWTI6Monthly crude oilfuturesElectronic disk prices Thursday(5month9day)Closing down0.52USD, decline0.84%Report61.60dollar/Bucket. Oil prices came under pressure on Thursday as investors are concerned that if the United States and China cannot reach a trade agreement, crude oil demand will slow down, as trade disputes could hit economic growth. Meanwhile,ICEBrent7The electronic price of monthly crude oil futures closed down0.08USD, decline0.11%Report70.29dollar/Bucket. The trade dispute has raised concerns in the market about a slowdown in crude oil demand! The trade dispute between the world's two largest economies and the significant decline in global stock markets have offset the impact of geopolitical tensions and oil production cuts. The reduction in crude oil production has led to a global supply decline in Latin America, Africa, and the Middle East.
Crude oil was available yesterday62.17-60.90The fluctuation within the range is in line with expectations, and the daily chart has entered a cycle of yin and yang oscillation. The weekly chart has ended, and the oscillation continues.4The hourly Bollinger Bands began to close, yesterday's retracement was supported by the lower track, and today's opening further rose to the upper track. Currently62.30Still a pressure port, previously62.90It is a bearish defense, as repeated dips and rebounds have disrupted the downward channel of the short-term chart, breaking the weak trend. The Bollinger Bands have turned into a volatile range, and it is not advisable to be overly bearish until the low point is temporarily broken. The short-term volatility strategy should be approached accordingly. Overall, in terms of future operational strategies, it is wise to have a discerning eye for new ideaswdy6638My personal suggestion is to sell high and sell low, and pay attention to the pressure above62.8-63.0Frontline resistance, short-term focus below60.8-61.0Frontline support.
Suggestions for crude oil operation:
1Rebound62.8-63.0Short on the front line, stop loss0.4US dollars, look at the target61.2-61.4frontline
2Callback61.0-61.2Long on the front line, stop loss0.4US dollars, look at the target62.0-62.2frontline
Due to differences in platform locations, the above analysis does not provide specific entry points. Additionally, due to the delay in online publishing, operational recommendations are for reference only. Please ensure risk control, and the specific operational plan will be subject to real-time guidance from Professor Gong Chonghao's "Insight Teacher"! Friends who have a set of orders can contact Huiyan Shixin and tell me the specific position situation. Gong Chonghao, the 'Huiyan Teacher', will provide a suitable strategy for you free of charge based on your situation. The market is constantly changing. For more market analysis and timely operational strategies, please contact the author
Guidance time: early6:00In the early morning of the next day2:00
Wen//Insight and recognition of Xin ( finger/guide/tiny/letter : wdy6638 ) |
"Small gifts, come to Huiyi to support me"
No one has offered a reward yet. Give me some support
|


 ZFX山海证券:金价冲高回落!多空鏖
Wednesday(2month4日)黄金市场上演了一出惊心动魄的“过山车”行情,现货黄金在周三盘中早些
ZFX山海证券:金价冲高回落!多空鏖
Wednesday(2month4日)黄金市场上演了一出惊心动魄的“过山车”行情,现货黄金在周三盘中早些
 How to buy gold investment?2025Novice Lazy Bag:6
In today's uncertain global economic outlook and inflationary pressures, many people are seeking safe havens that can safeguard asset values. “
How to buy gold investment?2025Novice Lazy Bag:6
In today's uncertain global economic outlook and inflationary pressures, many people are seeking safe havens that can safeguard asset values. “
 goldUSD解析:报价、投资管道与美元
Are you curious about the glittering gold market, yet always caught off guardXAU/USD」这串神秘代码搞得晕头转向
goldUSD解析:报价、投资管道与美元
Are you curious about the glittering gold market, yet always caught off guardXAU/USD」这串神秘代码搞得晕头转向
 2026What are the legitimate gold investment software for the year?
2026The intensification of global economic fluctuations in the year has highlighted the safe haven and preservation properties of gold speculation, attracting a large number of investors to enter the market
2026What are the legitimate gold investment software for the year?
2026The intensification of global economic fluctuations in the year has highlighted the safe haven and preservation properties of gold speculation, attracting a large number of investors to enter the market
 2026London Gold's official platform ranking has been released! Six major holdings
With the intensification of global economic uncertainty, frequent geopolitical conflicts, and sustained high inflation pressure, London gold has become a classic
2026London Gold's official platform ranking has been released! Six major holdings
With the intensification of global economic uncertainty, frequent geopolitical conflicts, and sustained high inflation pressure, London gold has become a classic


 Riser card
 Top card
 Silence card
 Color changing card
 lifting jack