"Small gifts, come to Huiyi to support me"
No one has offered a reward yet. Give me some support
| |
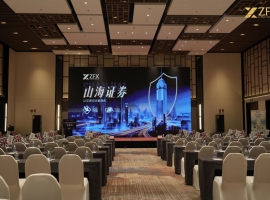 以安全之名,赴蓉城之约 | ZFX 山海
6 month 27 Day, by ZFX 山海证券联合汇友驿站主办的 "2026 交易技术峰会・成都站" 在蓉城
以安全之名,赴蓉城之约 | ZFX 山海
6 month 27 Day, by ZFX 山海证券联合汇友驿站主办的 "2026 交易技术峰会・成都站" 在蓉城
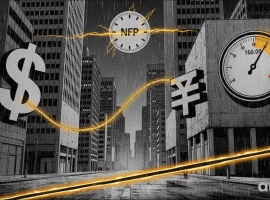 Aurra Markets:美元兑日元走势分析
美元兑日元:非农数据前的高风险“博弈对决” 美元兑日元(USD/JPY)当前正处于一场
Aurra Markets:美元兑日元走势分析
美元兑日元:非农数据前的高风险“博弈对决” 美元兑日元(USD/JPY)当前正处于一场
 Aurra Markets:SpaceX 多头卷土重来
Rocket Lab 股价飙升之际,SpaceX 多头是否在押注快速获利机会?近期,Rocket Lab
Aurra Markets:SpaceX 多头卷土重来
Rocket Lab 股价飙升之际,SpaceX 多头是否在押注快速获利机会?近期,Rocket Lab
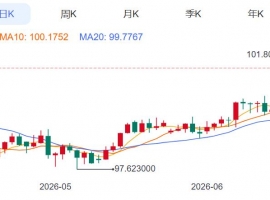 ZFX山海证券:金价周线四连阴!
现货黄金在上周五(6month26日)勉强反弹1.35%, received at4081.02dollar/盎司,但这微不足道的涨
ZFX山海证券:金价周线四连阴!
现货黄金在上周五(6month26日)勉强反弹1.35%, received at4081.02dollar/盎司,但这微不足道的涨
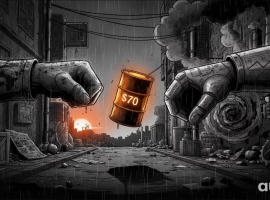 Aurra Markets:WTI Crude oil falls below 70 beautiful
WTI 原油价格下一步走势如何?WTI原油目前正处于多空叙事激烈拉锯的状态之中,使市
Aurra Markets:WTI Crude oil falls below 70 beautiful
WTI 原油价格下一步走势如何?WTI原油目前正处于多空叙事激烈拉锯的状态之中,使市
MIP|Mobile version|A small dark room| |Site Map |customer serviceQQ:2381682638
Copyright © 2006-2024 Huiyi Interaction https://www.forexbbs.net copyright All Rights Reserved.


 Riser card
 Top card
 Silence card
 Color changing card
 lifting jack