"Small gifts, come to Huiyi to support me"
No one has offered a reward yet. Give me some support
| |
|
金金有道,义者生财
|
|
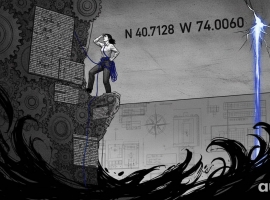 Aurra Markets:【欧元兑美元走势预
欧元兑美元强势反弹:关键阻力位面临突破还是假突破?能源价格回落及美元走软,为欧
 Aurra Markets:10 月就业报告前瞻,
10 月就业报告有何值得关注的看点?定于周五公布的 10 月就业报告备受市场关注,预
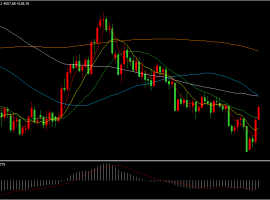 美国中期选举结果对黄金影响巨大!SI
this morning11.5国际现货黄金延续了前一日的强势,现货黄金盘中突破4100dollar/盎司,一度触及4
 Aurra Markets:铜价面临关键抉择,
铜价是否预示全球经济格局正在转向?当前,铜价正处于关键十字路口,短期经济逆风与
 Aurra Markets:美国民主党与国会:
民主党掌控国会将如何影响您的财务状况?近期美国选举带来了美国政坛的重大变化,民


MIP|Mobile version|A small dark room| |Site Map |customer serviceQQ:2381682638
Copyright © 2006-2024 Huiyi Interaction https://www.forexbbs.net copyright All Rights Reserved.





 Riser card
 Top card
 Silence card
 Color changing card
 lifting jack