Register now, make more friends, enjoy more functions, and let you play in the community easily.
You need Sign in Can be downloaded or viewed without an account?Register Now 
x
| 导语:不要因为没有阳光,而走不进春天。不要因为没有歌声,而放弃自己的追求。不要因为没有掌声,而丢掉自己的理想。其实每一条都通往阳光的大道,都充满坎坷 |
Message surface:
internationalgoldWednesday(3month28日)在更多的获利回吐卖盘打压继续大幅下挫,金价跌破1340and1330大关,美市盘中最低下探至1323.20dollar/盎司。周三美元继续反弹,美市盘中最高触及89.88,但仍运行在89整数关口下方。日内公布的美国第四季度实际GDP年化季率终值为2.9%, higher than the previous value2.5%And expectations2.7%,意味着美国经济的整体强劲的态势已经比较清晰,PEC和私人投资将会回升;美国2月成屋签约销售指数月率为3.1%,高于前值和预期,这两个数据对美元形成了较大的提振,金银则应声下跌。
周三在美GDP数据发布前黄金已经受到获利盘抛压的影响下挫,数据公布后投资者做出反应抛售加剧。分析称,近期股市的动荡,投资者避险情绪有所回归,但金价并未受益。目前从技术上看,美股从顶部滑落的趋势加重,若美股转熊,对金市将形成长期利好。技术上看,黄金再度跌回1330大关的下方,三顶回落的形态较为明显,周二在触及五周高位后的大跌,再加上周三的大跌,使金价从技术面遭受一定的重创。下行方面,1340and1330的支撑位已破,接下来将考验1320and1310的关口,若此两关连续下破,则将进一步考验1300大关,做多者宜谨慎。但也有分析指出,逢低吸纳也是推荐策略之一,因黄金的避险地位仍较为牢固。
Gold analysis:
黄金:美元的企稳反弹,对贸易战和地缘局势的担忧情绪降温,令金价拖累明显,短线技术面看空信号有所增加,后市偏向震荡下行日线级别,近三个月金价处于震荡走势,短线受阻于阻力位后,KDJRebuilt the dead fork,K线“乌云盖顶”后紧跟一根中阴线,而且阴线的下影线极短,短线仍存进一步下探风险,初步支撑在3month16Daily high point1321.61Nearby,100The daily moving average is supported by1309.30Nearby, the Bollinger Line's lower track supports1305.88Nearby, then1300整数关口附近支撑。由于金价仍在布林线中轨附近徘徊,MACD金叉信号仍未完全被批号,隔夜大跌后,短线也有可能小幅调整或者反弹,金石生财认为上方初步阻力在10Daily moving average1329.87Nearby,5Daily moving average resistance1339.34附近,需要收复该位置才能缓解短线下行风险。需要提防的是,金价如果早亚欧时段小幅下探并在1320整数关口获得支撑,也有可能出现一些逢低买盘,日内金价可能会在1320-1336Interval oscillation.
4小时级别,金价暂时处于单边下跌走势,MACD死叉运行并下穿零轴,布林线开口,KDJ死叉运行,短期均线空头排列,金价可能会延布林线下轨震荡下探前低1307.06附近支撑,当然1320整数关口附近还存在一些支撑。另外,金价目前仍未有效跌破1307-1356Upward trend61.8%Retreat position1326.07Nearby support,KDJ处于超卖区域,短线也存在调整的可能,初步阻力在50%Retreat position1331.94Nearby, then1337.81附近,布林线中轨阻力在1343.02附近,如果意外收复该位置,则缓解短线下行风险。
Suggestions for Gold Operations:
1、1327Frontline empty orders entering, stop loss4US dollars, look at the target1320一线,跌破持有看目标1315frontline;
2Below1320Short term, stop loss3US dollars, look at the target1325frontline;
crude oilanalysis:
美原油日线图来看,日线上布林带三轨开口运行,KThe line runs between the upper and middle tracks in the Bollinger Belt,MA5Mean Square andMA10Moving average crossing operation,MA5The moving average starts turning downwards atKAbove the line, a suppression is formed, while the remaining moving averages are arranged in a multi headed patternK线下方相继形成多重支撑,指标MACD红色多头能量柱微微放量。4From the hourly chart, it can be seen that the upper track of the Bollinger Bands is flat, while the middle and lower tracks continue to move downwards, indicating that there is still room for crude oil to decline in the short term.KThe line runs between the middle and lower tracks of the Bollinger Bands, with the upper part receiving the middle tracks of the Bollinger Bands65.0Frontline suppression.MA5AndMA10Crossing dead ends and forksKPressing is formed above the line,MA60average63.7On the front lineK线下方相继形成多重支撑,指标MACDThe green bearish energy column continues to increase in volume,DIFTurn the head and pass it throughDEA形成死叉持续运行,表明原油虽然目前多头趋势暂未完全改变,上方可先关注65.0A line of resistance, let's take a look below first63.7一线支撑,操作上金石生财建议以反弹做空为主,严格带上止损。每日解剖市场动态行情分析以及解.套策略、获取更为及时的操作策略以及最新资讯。
Suggestions for US crude oil operations:64.9-64.8Short selling, stop loss0.4USD, target64.2Near.
| 没有不成功的投资,只有不成功的操作。对原油,黄金等贵金属投资有兴趣却无从下手或者已经在接触却并不理想的朋友,( |
| )获取每日行情走势分析,交易策略指导,《金石生财》谨慎套单锁单操作不理想可与本人沟通交流, |
|
"Small gifts, come to Huiyi to support me"
No one has offered a reward yet. Give me some support
|

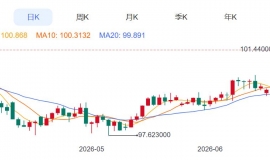
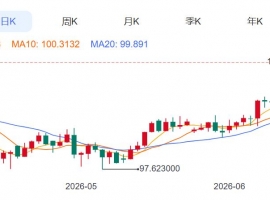 ZFX山海证券:金价退守4100USD barrier
全球黄金市场正在经历一场剧烈的调整。周二(6month22日)现货黄金价格大幅下跌1.9%,触
ZFX山海证券:金价退守4100USD barrier
全球黄金市场正在经历一场剧烈的调整。周二(6month22日)现货黄金价格大幅下跌1.9%,触
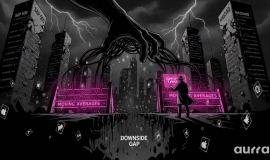
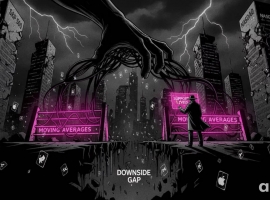 Aurra Markets:标普 500 技术性破位
为何标普 500 和纳斯达克指数同步抛售?一轮显著的隔夜跳空下跌,使标普 500 指数与
Aurra Markets:标普 500 技术性破位
为何标普 500 和纳斯达克指数同步抛售?一轮显著的隔夜跳空下跌,使标普 500 指数与
 Aurra Markets:韩国 KOSPI Index plummeting
韩国股市为何遭遇最糟糕交易日之一? 韩国股市近期出现剧烈震荡,股价大幅下跌,引
Aurra Markets:韩国 KOSPI Index plummeting
韩国股市为何遭遇最糟糕交易日之一? 韩国股市近期出现剧烈震荡,股价大幅下跌,引
 原油期货是什么?一篇搞懂WTI、布兰
近年来国际油价如同云霄飞车,剧烈的波动不仅影响着你我的荷包,更吸引了全球投资者的目
原油期货是什么?一篇搞懂WTI、布兰
近年来国际油价如同云霄飞车,剧烈的波动不仅影响着你我的荷包,更吸引了全球投资者的目
 2026year6month23day Evening17:12 金价跌破41
今天这行情真是够刺激的。早上开盘金价还在4190附近晃悠,结果亚盘直接跳水,一
2026year6month23day Evening17:12 金价跌破41
今天这行情真是够刺激的。早上开盘金价还在4190附近晃悠,结果亚盘直接跳水,一


 Riser card
 Top card
 Silence card
 Color changing card
 lifting jack