Register now, make more friends, enjoy more functions, and let you play in the community easily.
You need Sign in Can be downloaded or viewed without an account?Register Now

x
todayUltimaMarkets Bringing you 2024year 3month 15Ribrentcrude oilIn depth analysis.
Fundamental points - IEAPredicting an increase in demandDue to the International Energy Agency raising its forecast for oil demand growth this year, and due to OPEC+Production reduction measures, expected2024The annual oil supply and demand will turn slightly insufficient.
- Weak retail sales data: USA2The monthly retail sales rate is weak, recording0.6%Less than expected0.8%, previous value from-0.80%Downward revision to-1.1%;
technical analysis Daily chart analysis Brent crude oil daily chart, sourceUltima Markets MT4)
- Random oscillation index: Indicator in50Above the median line, a bullish signal is issued, indicating that the bearish trend is not strong, and off market bullish forces are beginning to enter the market. There is a probability of further increase in oil prices in the short term.
- Breaking through the intervalOil prices in black65The daily moving average has fluctuated and adjusted for nearly a month, and oil prices broke through the high point of the fluctuation range yesterday after hitting the moving average for the last time on Monday. The overall upward trend is very healthy, and it is worth paying attention to opportunities for long positions.
1Hour chart analysis Brent crude oil1Hour chart, sourceUltima Markets MT4)
- Random oscillation index:The indicator has deviated from the overbought area, and the overall trend is steadily declining. After waiting for the indicator to issue a bullish signal again, we can focus on the long selling opportunities
- Supporting price rangeOil prices are in adjustment, with targets below looking towards an upward trend line and black33The support area composed of a combination of periodic moving averages. Based on the close oscillation period in the early stage1In the past month, oil prices may rise further after adjustment.
Trading CentralHub Line Indicators file:///C:/Users/LIESUE~2/AppData/Local/Temp/msohtmlclip1/01/clip_image006.gif (US crude oil)30Minute chart, sourceUltima Markets APP)
- according toUltima Markets APPInTradingCentralHub line indicators, central price range for the day80.30,
- 80.30Upward bullish, first goal81.60Second objective82.00
- 80.30Under bearish, first target79.90Second objective79.40
Disclaimers The comments, news, research, analysis, pricing, and other information contained in this article can only be considered as general market information and are provided solely to assist readers in understanding the market situation and do not constitute investment advice.UltimaMarketsReasonable measures have been taken to ensure the accuracy of the data, but the accuracy of the data cannot be guaranteed and can be changed at any time without notice.UltimaMarketsWe will not be responsible for any losses or losses (including but not limited to any loss of profits) that may arise from the direct or indirect use or reliance on such information.
| 
 CPT Markets【行情快报】美国内需强
dollar/Japanese yen(USDJPY):
新闻事件:日元兑美元汇率周三美盘尾盘飙升,因为市场参
CPT Markets【行情快报】美国内需强
dollar/Japanese yen(USDJPY):
新闻事件:日元兑美元汇率周三美盘尾盘飙升,因为市场参
 CPT Markets【行情快报】美联储持续
gold/dollar(XAUUSD):
新闻事件:周三,在美联储维持利率不变,同时宣布将降
CPT Markets【行情快报】美联储持续
gold/dollar(XAUUSD):
新闻事件:周三,在美联储维持利率不变,同时宣布将降
 Ultima Markets:【市场热点】美联储
stay5月例会上,美联储连续第6次维持联邦基金利率在5.25%-5.50% section. 通胀停滞和趋紧
Ultima Markets:【市场热点】美联储
stay5月例会上,美联储连续第6次维持联邦基金利率在5.25%-5.50% section. 通胀停滞和趋紧
 Ultima MarketsMarket Analysis: Federal Reserve
todayUltimaMarkets Bringing you 2024year 5month 2日的黄金深入分析。
Fundamental points
[*] drop
Ultima MarketsMarket Analysis: Federal Reserve
todayUltimaMarkets Bringing you 2024year 5month 2日的黄金深入分析。
Fundamental points
[*] drop
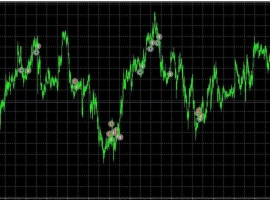 KentTrendTrend scalp has source code: there has been news
KentTrendIt's a trendy scalpEA. It is called a trend because all trades are along the trend and open positions at the point of trend correction;
KentTrendTrend scalp has source code: there has been news
KentTrendIt's a trendy scalpEA. It is called a trend because all trades are along the trend and open positions at the point of trend correction;


 Riser card
 Top card
 Silence card
 Color changing card
 lifting jack